Internet Usage and Income in the United States
April 24, 2009
Team: Jason Motta, Jeff Richard, Scott O’Meara
By use of statistical data it is our intent to define the age and income of internet users. Geographical placement and penetration by area, education and overall usage. The United States has a population of 304,228,257 people and , of that population used the internet as of 12/31/08. The internet has a strong influence on our economy and by defining its users their income and Geographic location the data can be used to effectively market products for their varying markets.

Penetration of internet users versus total population 12/31/2001

Penetration of internet users versus total population 12/31/2008

As you can see the number of inter net users has virtually tripled within the span of seven years. The internet has rapidly gained in users comprising the majority of the U.S population.
Income and Internet Usage

The largest percentage of Americans that use the internet fall below the 50k a year income range. This would suggest that either low income or young users (who start at lower base pay) are more likely to use the internet.

By plotting the percent of users by age however the 18-34 year old range only account for 31% of users and the greatest number of users fall within the 35 to 54 year old range.
After examining age with relation to usage the data can be organized to show income and access to the internet.

After analyzing internet access and Age the income for the North East and percent users to population appear to be similar through out the the North East.


The Population of the Us States Plotted against Income shows very little correlation.


Reviewing geographic data vs income and internet usage the data shows little or no correlation.

Based on the available information, this graph shows the ratio of Ave. Internet Users to Ave. Income. This information shows that based on averages the more you make the more internet users in a given area. The information is not substantial, but does show a linear trend of Internet Users Vs. Income.

Compiled Data For State Income Vs. Internet Usage


Data Sources:
http://www.internetworldstats.com/america.htm
Click to access Table_HouseholdInternet2007.pdf
Worked With:
Jeff Richards, Scott O’Meara
Patterns in DNA
April 13, 2009
DNA is the code that controls reproduction and evolution. DNA is the key to humanities future. The code is a combination of adenine (abbreviated A),cytosine (C),guanine (G) and thymine (T) that makes up a DNA strand called the double helix. Important segments of code have patterns that can be indicators of complimentary palindromes. Complimentary Palindromes is a sequence that reads in reverse order as a compliment of a forward sequence (text chapter 4).
Virus replication can be marked by complimentary palindromes. To test for these comlimentary palindromes the DNA strand is segmented and tested to see if it can replicate. If the segment is incapable of replication it musn’t contain the origional code sequence.
Below is a scatter plot of the given sequence.

other random sequences were plotted to compare for breaks that do not appear randomly


Dungeness Crab Growth
March 27, 2009
How large fluctuations in population relate to fishing solely of male Dungeness crabs
Dungeness crabs crabs are fished on the Pacific coast and are an important crop for Pacific Fisherman. The Dungeness crab take on the U.S west coast consists of almost the entire male population. The population of Dungeness crabs has been threatened by over fishing and some believe that the inclusion of the female population with a restriction on take may be the answer. The canadian fishing industry allows for fishing of female crab and their population does not seem to have the fluctuations exhibited with the U.S.
The Data below relates Premolt with Postmolt size. By overlaying a linear equation into the scatter plot of pre molt vs. post molt a relative linear relation is formed.

predicted

After testing the values from the actual and the predicted they simulate the data closely. The predictor is an excellent fit and is a good predictor. Shown below is the actual data plotted against a line forced through zero.

After taking a much smaller sampling and calculating the actual pre molt versus the calculated pre molt the data has a much greater error. The sample must be large enough for the derived equation to be usable.

Who Plays Video Games
February 20, 2009
A recent survey was taken of 91 students to identify how often they play video games. The survey contained categories for example time, gender, age, work hours and basic computer skills information. Of the those surveyed 36.9% (below in red) of the overall 91 students had played video games within the week prior . 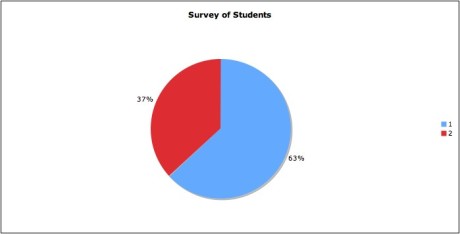
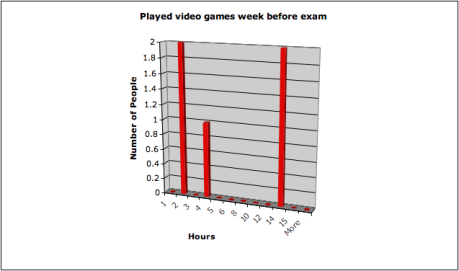
The time used playing video games varies widely between students who play video games and the hours they play. Most students do not play games at all where as the few who play may have excessive hours(chart below).
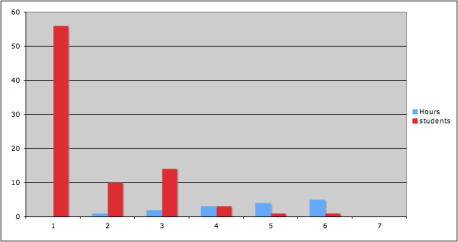
The interval estimate for provided data (below) shows that the average amount of time playing video games vary in a manner in which the data cannot be used to accurately represent the population. The actual mean and the calculated have a large difference rendering the derived data ambiguous .
In[2]:= <<HypothesisTesting`
Out[17]= 3.0027
In[17]:= Mean[Time]
Out[18]= 5.50103
MeanCI[Time,ConfidenceLevel->.95]
Out[20]= {1.16857,4.83684}
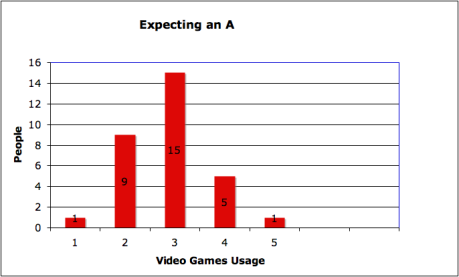
Below is the number of students expecting to achieve an A in their classes and their associated game play in relation to grading. Showing that of students who play video games those who restrict their game play to around three hours or less weekly have a better chance of still attaining an A.
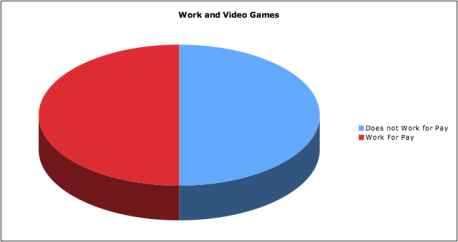
Below is the Number of students who work and do not work for pay (chart below).The number of students who play games and work for pay is about even.
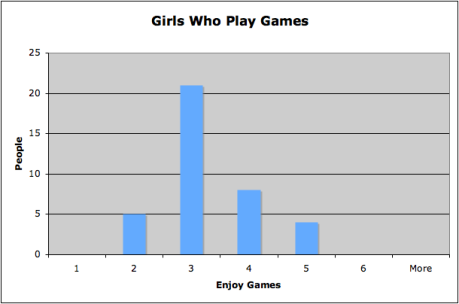
There are a greater number of woman that do not like to play video games as a group.
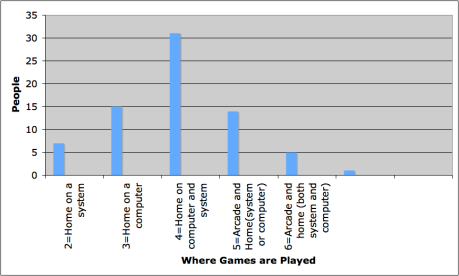
The largest group of people who play games are home computer users.
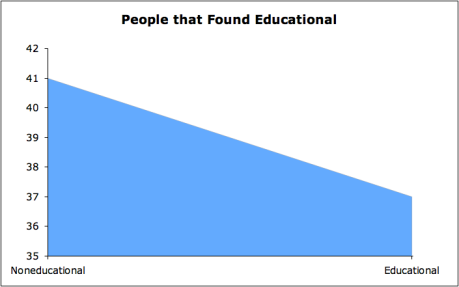
Most people regard Video games as non-educational.
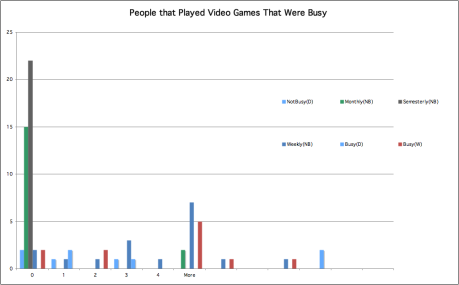
The largest group of people who played video games are those that were busy.
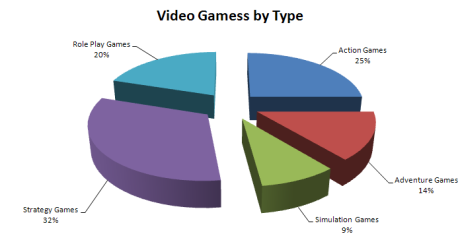
Games Played by Type
worked with – Jeff Richards –
Infant Birthweight and Smoking
January 28, 2009
Low Birth Weight may be Attributed to Smoking in Woman
Using data collected from a Berkley Study, smoking in woman may correlate to reduced birth weight in infants. The study was conducted using a total of 1236 recent births records. A total of 741 non-smokers and 483 smokers were included in the study. Data collected without a determined status of smoker or non-smoker was removed from the analysis, accounting for 12 undetermined recent birth weight records.
The graphs (below) exhibits a shift in birth weights of mothers who smoke in relation to mothers who do not smoke. Smoking mothers are more likely to have infants that are born with less birth weight. A sampling of birth rates were placed into preset birth weight ranges and tallied to compile the histogram below. The distribution was then taken and skewness was tested. Skewness determines whether the sample is evenly distributed around the mean or center point of the data. The skewness of the samples was calculated resulting in a positive skewness (.0336) for woman smokers and non-smokers had a lower skewness(.0187). Lower birth weights due to smoking occur more frequently below the median of the data. This suggests a lower birth weight has a relation to smoking. The data below was utilized to determine these results.

Birth weight of infants from Non-Smoking mothers

Birth weight of infants from smoking mothers

number mean smoker 114
mean non-smoker 123
median smoker 110
median non-smoker 115
smoker standard deviation 18.1
non-smoker standard deviation 17.4
Overall Skewed -.014
Non-smokers -.0187
Smokers -.0336
STANDARD DEVIATION
Skewness 

